Home What is Real Science Climate Facts Our Best Data Trillion Dollar Industry Big Money Scaring green money Paid by fossil fuel Warming Stopped Media Lies Extreme Weather? CO2 didn't warm arctic CO2 & Rate of warming CO2 Innocent! 1/2 of Warming Wrong Its Warming,But Acidification IPCC_Flawed Harming People misconduct Data Adjustments Cooling since 1945? Drought, hurricanes etc. Arctic Antarctic Selected Emails Selected Quotes Fraud Of Century? 97 percent of scientists 25% of AMS / 50% JonesInterview An OK Prediction Data Sources False Deadlines Real Cause of Climate Record Temperature Climate Change Truths Its OK to Lie! Energy Facts GridStorage CostlyEnergy Mann's Book Wegman styn_vs_mann Peer Review Error Statistical Errors The Sun Solar OceanHeat Ocean Heat Polar Bears OK AlGore's Errors IPCC_Disproved IPCC_PeerReview Ask Questions Climate Models Local Food IPCC&CLouds Threats Why I'm a Skeptic GreenhouseMoon Alternative Energy 1350+ realist papers Conflict of Interest? Muzzeled Scientists How To Argue Common Ground Hurricane No Proof NW Snow Pack James Hansen Consensus The Hockey Stick 650 Dissenters Easy Solution IPCC Scientists DataQuality Heat Island Is Science Settled? Ocean Level Sea Level Glaciers Ice Sheets Greenland Gore's Mentor OGWC Articles Summary FinancialPapers OtherMotivations PeakOil Ozone Hole Fracking Acid Rain No Limits Videos Printables Links Briffa et al (1998) data

Debunking the Climate Scam

Billions of Dollars -  Fudged Data  -  Corrupt Scientists

Greedy Green Corporations - Trillion Dollar Prize

No Warming For Two decades - Illiterate Media

Bought and Paid For Organizations


Email WebMaster

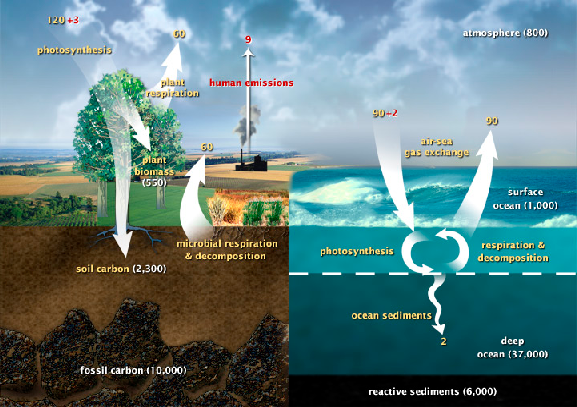
NASA Carbon sources chart

From; http://earthobservatory.nasa.gov/Features/CarbonCycle/page1.php

Do the Math:


Man-14

Total-224

Man’s Portion:

6.25%        

PDF of this page:   Portrait   Landscape

This diagram of the fast carbon cycle shows the movement of carbon between land, atmosphere, and oceans. Yellow numbers are natural fluxes, and red are human contributions in gigatons of carbon per year. White numbers indicate stored carbon. (Diagram adapted from U.S. DOE, Biological and Environmental Research Information System.)

Data from chart

Natural CO2 Sources

Plant Respiration

60

Microbial respiration

60

Air-sea gas exchange

90

TOTAL Natural

210

Man’s CO2

Man

14

Man’s % (14/224)

6.25%