Debunking the Climate Scam
Billions of Dollars -
Greedy Green Corporations -
No Warming For Two decades -
Bought and Paid For Organizations

5000 Years Of Climate Change From Greenland Ice Cores

Short excerpts of a story at Watts Up With That
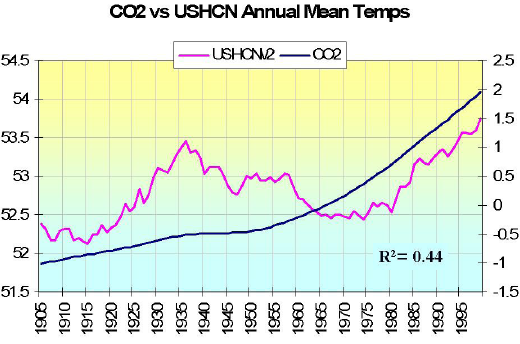
Here is the correlation between CO2 and Annual Mean Temperature followed by the correlation between Total Solar Irradiance and temperature.
Solar correlates better than CO2 as a drive of climate!
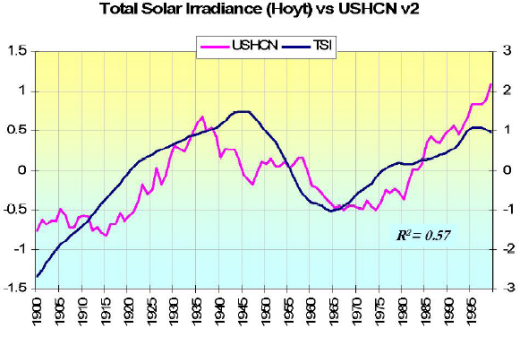
Clearly the US annual temperatures over the last century have correlated far better with cycles in the sun and oceans than carbon dioxide. The correlation with carbon dioxide seems to have vanished or even reversed in the last decade.
Given the recent cooling of the Pacific and Atlantic and rapid decline in solar activity, we might anticipate given these correlations, temperatures to accelerate downwards shortly.
Read the whole story at Watts Up With That
MORE:
Omitted variable fraud: vast evidence for solar climate driver rates one oblique sentence in AR5
71 new papers reported in 2013 demonstrating the Sun controls climate, not man-
Over 200 peer-
over 100 potential solar amplification mechanisms described in the literature.
Peer Reviewed Paper Discovers
Planetary Temperature set only by sun & atmospheric pressure
Saturday, August 22, 2015
New paper confirms the gravito-
An important new paper published in Advances in Space Research determines that the Earth surface temperature (as well as the surface temperatures of 5 other rocky planets in our solar system) can be very accurately determined (R2 = 0.9999! & tiny standard error σ=0.0078) solely on the basis of two variables:
1) atmospheric pressure at the surface, and
2) solar irradiance at the top of the atmosphere,
and without any consideration of any greenhouse gas concentrations or 'radiative forcing' from greenhouse gases whatsoever.
Thus, the paper adds to the works of at least 40 others (partial list below) who have falsified the Arrhenius radiative theory of catastrophic global warming from increased levels of CO2, and also thereby demonstrated that the Maxwell/Clausius/Carnot/Boltzmann/Feynman atmospheric mass/gravity/pressure greenhouse theory is instead the correct explanation of the 33C greenhouse effect on Earth, and which is independent of "radiative forcing" from greenhouse gases.
Using observed data from the planets Earth, Venus, the Moon, Mars, Titan, and Triton, the authors,
"apply the Dimensional Analysis (DA) methodology to a well-
Read the rest at: http://hockeyschtick.blogspot.com/2015/08/new-
Link to paper: Emergent model for predicting the average surface temperature of rocky planets with diverse atmospheres
By Volokin and Liez, Advances in Space Research, Aug 18, 2015 (h/t WUWT) (http://www.sciencedirect.com/science/article/pii/S0273117715005712 (A PDF can be downloaded by expanding the paper’s view window to full screen and choosing print.)
New paper finds ‘robust’ relationship between
cosmic rays and global temperature,
corroborates Svensmark’s solar-
http://hockeyschtick.blogspot.com/2015/08/new-
Link to paper: Reply to Luo et al.: Robustness of causal effects of galactic cosmic rays on interannual variation in global temperature
By Ye, et al, PNAS, Aug 25, 2015 http://www.pnas.org/content/112/34/E4640.extract
Climatologist Dr. Tim Ball On 97% Consensus:
“Completely False And Was Deliberately Manufactured”!
'97% Of Climate Scientists Agree' Is 100% Wrong
Warming Trend: PDO And Solar Correlate Better Than CO2
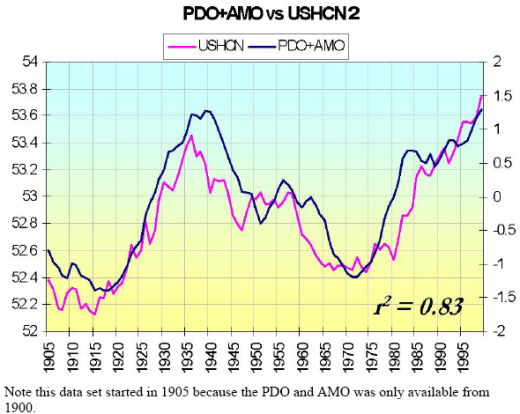
Graph from: https://wattsupwiththat.com/2008/01/25/warming-
1900 to 2011 Cumulative CO2 Concentration, Anthropogenic CO2 Emissions and Temperature
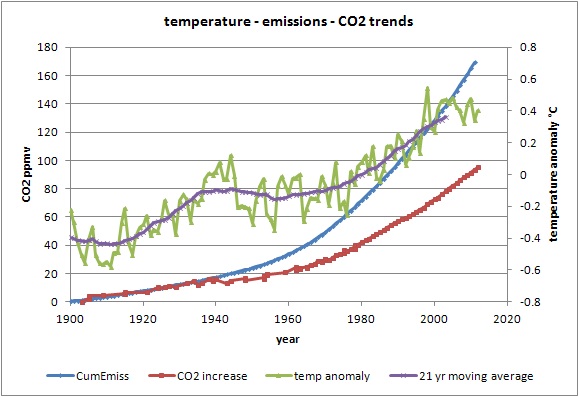
Ferdinand Engelbeen – Mauna Loa – Law Dome – Siple Dome – US Department of Energy (DOE) – Hadley Center –
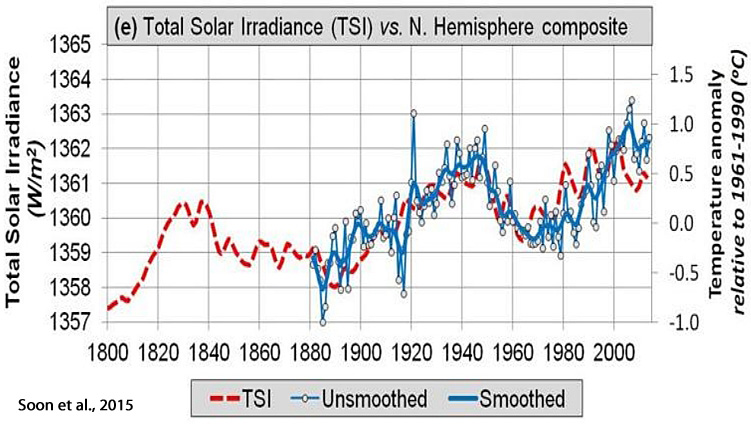

In late 2015, Soon, Connolly, and Connolly (hereafter SCC15) published a comprehensive
(101 pages) analysis of how the modern anthropogenic global warming (AGW) paradigm
has been constructed. The paper, published in Earth Science Reviews, is entitled
Re-
“...most of the temperature trends since at least 1881 can be explained in terms of solar variability, with atmospheric greenhouse gas concentrations providing at most a minor contribution.
What follows is a very brief summary of some of the graphical highlights in SCC15 as well as the fully cited conclusion. Succinctly, the paper can be divided into 2 parts.
1. The instrumental temperature record has undergone heavy adjustments (a utilization of an urban temperature station siting bias) to allow a better fit with climate models that presume CO2 emissions drive temperature.
2.. CO2-
The peer reviewed paper (soon2015.pdf): http://www.sciencedirect.com.sci-
| Warming Stopped |
| NOAA Data |
| NorthWest |
| Oregon |
| Washington |
| Extreme Weather |
| Past Was Warmer |
| NASA: 30's Hotter |
| PastBeliefs |
| HistoryOFAlarmism |
| Central England |
| Temperature History |
| MultiProxy |
| treemometers |
| Northwest Passage |
| Acidification-Ball |
| Acidification-Fulks |
| Acidification-Idso |
| Selected Emails |
| CRU Emails - html formatted |
| CRU Emails Simple Format |
| CRU Emails UnFormatted |
| DCPS paper |
| CRU_Files_Notice |
| False Deadlines |
| Hockey Stick Links |