Debunking the Climate Scam
Billions of Dollars -
Greedy Green Corporations -
No Warming For Two decades -
Bought and Paid For Organizations

5000 Years Of Climate Change From Greenland Ice Cores
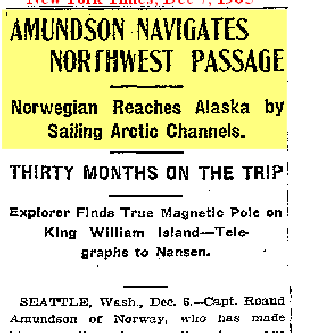
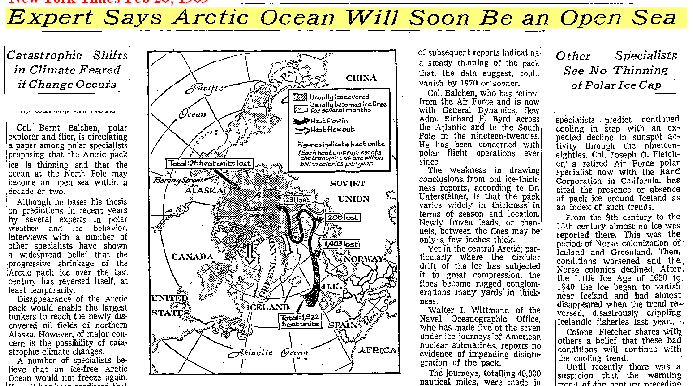
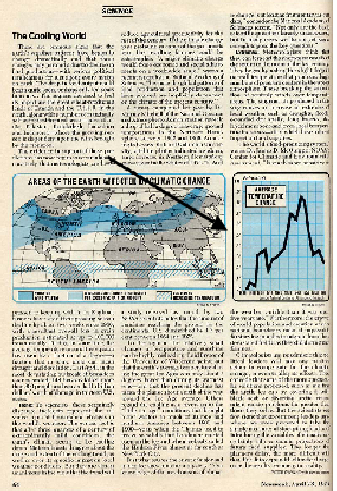
New York Times Dec 7, 1905
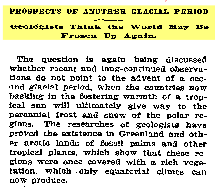
New York Times May 15, 1932
What Is Good Quality Proof?
Here is the Minimum Standard of Proof Required Before Taking Climate Action
- Prove that observed temperature increases are real.
- Prove that temperature increases are unusual in a historical context.
- Prove that CO2 actually can cause warming
- Prove the relationship between any given CO2 increase and temperature
- Prove what a dangerous amount of global warming actually is.
- Prove that man's CO2 is responsible for the observed increase in atmospheric CO2.
Absent proof that man is the cause of warming, no cessation of man's activities will change the weather and will have no effect on cuddly polar bears, glaciers, ice caps or ocean levels.
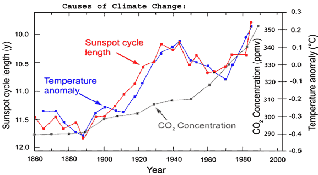
Notice the dip in both solar and temperature from about 1940-
Graph adapted by Dr. Tim Patterson.from: Friis-
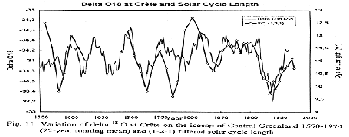
Graph from: Long-
First, A Brief History of Climate Change
New York Times Feb 24, 1895
Things Look Different When You See the Whole History
600 year history -
Source: Energy & Environment · Vol. 14, No. 6, 2003, pg 77
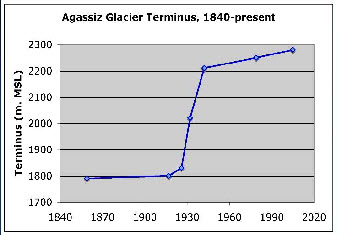
The majority of the glacier melting
occurred during the 1930s
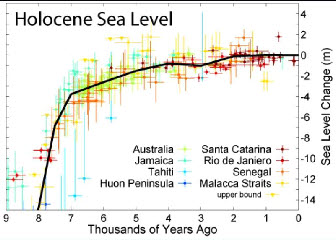
Sea Levels have been rising for thousands of years. Lately the rise has slowed down.
Slower Rise
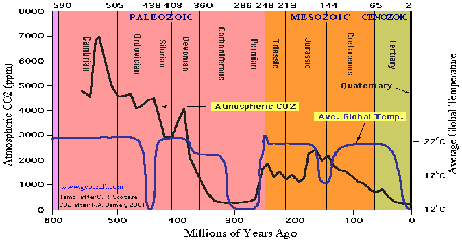
Late Carboniferous to Early Permian time (315 mya -
Temperature after C.R. Scotese http://www.scotese.com/climate.htm
CO2 after R.A. Berner, 2001 (GEOCARB III)
Today is unusually COOL with unusually low CO2
http://www.icecap.us/
http://surfacestations.org/
http://www.co2science.org/
http://www.junkscience.com/
http://www.climateaudit.org/
www.FriendsOfScience.org
http://scienceandpublicpolicy.org/
http://www.climate-
http://www.worldclimatereport.com/
Additional Information
Friis-
Proc. R. Soc. A doi:10.1098/rspa.2006.1773
Henrik Svensmark, Cosmoclimatology: a new theory emerges -
NAS report: www.nap.edu/catalog/11676.html
Wegman factsheet: http://republicans.energycommerce.house.gov/108/home/07142006_Wegman_fact_sheet.pdf
Wegman Report: http://www.uoguelph.ca/~rmckitri/research/WegmanReport.pdf
References
A note:
Coal is carbon taken out of the atmosphere by plants that ended up buried. Two conclusions come from this:
1. The earlier atmosphere had much more CO2 than now (and the earth did not turn into a burnt cinder.)
2. Returning that carbon to the atmosphere will, at most, merely return to the conditions of an earlier atmosphere. At the least, it will do nothing because of the earth’s natural negative feedback mechanisms.
New York Times Feb 20, 1969
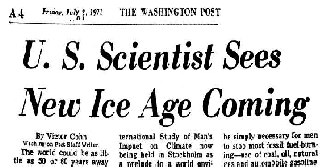
Washington Post July 9, 1971
Newsweek, April 28, 1975 -
Notice the Dramatic
Graph of COOLING
Just like You See
For WARMING Today.
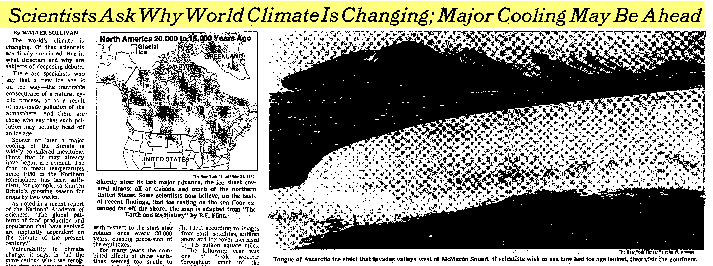
New York Times May 21, 1975
... All that the lag shows is that CO2 did not cause the first 800 years of warming, out of the 5000 year trend. The other 4200 years of warming could in fact have been caused by CO2, as far as we can tell from this ice core data. (From: realclimate.org/index.php?p=13) (Notice “could in fact have been”? That means that they don’t really know.)
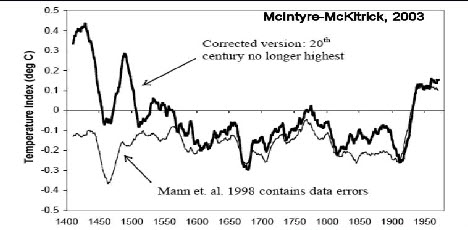
In general, we found MBH98 and MBH99 to be somewhat obscure and incomplete ... Normally, one would try to select a calibration dataset that is representative of the entire dataset. The 1902-
The criticism in MM03/05a/05b pointed out a number of flaws such as:
|
·
|
You can take red noise and put it into the algorithm used in MBH98 and get the famous hockey stick.
|
|
·
|
You can remove the bristle cone pines from the data set and the hockey stick disappears.
|
|
·
|
If you use the correct data centering methodology, the hockey stick disappears.
|
most of the field uses the same data and methods -
A complete list of things caused by global warming
Click on the above to see the complete list (http://www.numberwatch.co.uk/warmlist.htm)
Alarmists like to talk about an ice free Arctic and of ships sailing through the Northwest Passage.
Here is some history:
Amundson Navigated the Northwest Passage in the early 1900s:
http://en.wikipedia.org/wiki/Roald_Amundsen#Northwest_Passage
Royal Navy Navigated the Northwest passage During World War II:
http://www.ucalgary.ca/arcticexpedition/larsenexpeditions
Sailing the Northwest Passage
| Warming Stopped |
| NOAA Data |
| NorthWest |
| Oregon |
| Washington |
| Extreme Weather |
| Past Was Warmer |
| NASA: 30's Hotter |
| PastBeliefs |
| HistoryOFAlarmism |
| Central England |
| Temperature History |
| MultiProxy |
| treemometers |
| Northwest Passage |
| Acidification-Ball |
| Acidification-Fulks |
| Acidification-Idso |
| Selected Emails |
| CRU Emails - html formatted |
| CRU Emails Simple Format |
| CRU Emails UnFormatted |
| DCPS paper |
| CRU_Files_Notice |
| False Deadlines |
| Hockey Stick Links |