Debunking the Climate Scam
Billions of Dollars -
Greedy Green Corporations -
No Warming For Two decades -
Bought and Paid For Organizations

5000 Years Of Climate Change From Greenland Ice Cores

Guest Post by Willis Eschenbach
The GISS Model E is the workhorse of NASA’s climate models. I got interested in the GISSE hindcasts of the 20th century due to an interesting posting by Lucia over at the Blackboard. She built a simple model (which she calls “Lumpy”) which does a pretty good job of emulating the GISS model results, using only a model including forcings and a time lag. Stephen Mosher points out how to access the NASA data here (with a good discussion), so I went to the NASA site he indicated and got the GISSE results he points to. I plotted them against the GISS version of the global surface air temperature record in Figure 1.
Read the whole story at http://wattsupwiththat.com/2010/12/19/model-
What I Learned
1. To a very close approximation (R^2 = 0.91, average error less than a tenth of
a degree C) the GISS model output can be replicated by a simple linear transformation
of the total forcing and the elapsed time. Since the climate is known to be a non-
2. The GISSE model illustrates that when hindcasting the 20th century, the modelers were free to design their own forcings. This explains why, despite having climate sensitivities ranging from 1.8 to 4.2, the various climate models all provide hindcasts which are very close to the historical records. The models are tuned, and the forcings are chosen, to do just that.
3. The GISSE model results show a climate sensitivity of half a degree per doubling of CO2, far below the IPCC value.
4. Most of the assumed GISS forcings vary little from a straight line (except for some of them going flat in 1990).
5. The modelers truly must believe that the future evolution of the climate can be calculated using a simple linear function of the forcings. Me, I misdoubts that …
In closing, let me try to anticipate some objections that people will likely have to this analysis.
1. But that’s not what the GISSE computer is actually doing! It’s doing a whole bunch of really really complicated mathematical stuff that represents the real climate and requires 160 teraflops to calculate, not some simple equation. This is true. However, since their model results can be replicated so exactly by this simple linear model, we can say that considered as black boxes the two models are certainly equivalent, and explore the implications of that equivalence.
2. That’s not a new finding, everyone already knew the models were linear. I also thought the models were linear, but I have never been able to establish this mathematically. I also did not realize how rigid the linearity was.
3. Is there really an inherent linear warming trend built into the model? I don’t
know … but there is something in the model that acts just like a built-
4. Is this all a result of bad faith or intentional deception on the part of the modelers? I doubt it very much. I suspect that the choice of forcings and the other parts of the model “jes’ growed”, as Topsy said. My best guess is that this is the result of hundreds of small, incremental decisions and changes made over decades in the forcings, the model code, and the parameters.
Read the whole story at http://wattsupwiththat.com/2010/12/19/model-
Model Charged with Excessive Use of Forcing
Climate Model Failure
By Andy May
Read the Original with comments: https://wattsupwiththat.com/2021/02/02/climate-
On January 22, 2021, John Christy presented a new online talk to the Irish Climate Science Forum. The talk was arranged by Jim O’Brien. A summary of the presentation can be read at clintel.org here. In this post we present two interesting graphs from the presentation. These compare observations to the IPCC Coupled Model Intercomparison Project 5 climate models (CMIP5, 2013) and CMIP6 (current set of IPCC models) climate model projections.
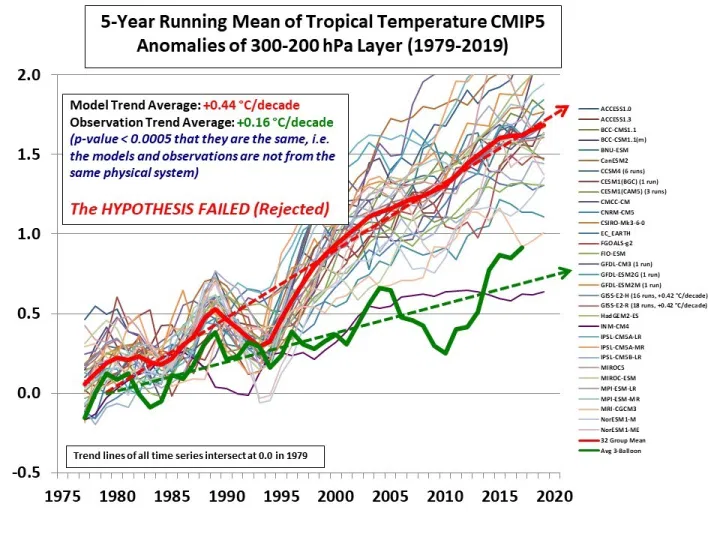
Figure 1. CMIP5 models versus weather balloon observations in green. The details of why the models fail statistically can be seen in a 2018 paper by McKitrick and Christy here.
The next graph compares the newer CMIP6 models to both the weather balloon data (light green) and the weather reanalysis data (dark green).
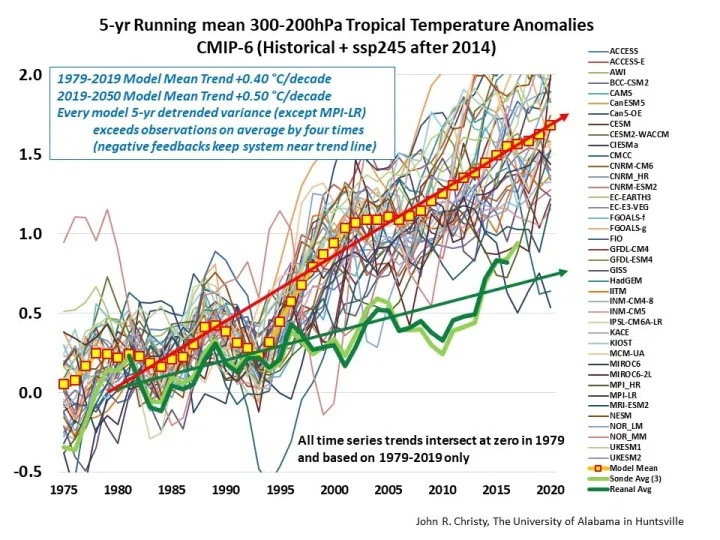
The difference between the models and the observations is statistically significant and shows that the models have been invalidated. It is also significant that the CMIP6 spread of model results is worse than the CMIP5 spread. Thus, the newer models show less agreement to one another than the previous set. “Houston, we have a problem.”
Read the Original with comments: https://wattsupwiththat.com/2021/02/02/climate-
| Warming Stopped |
| NOAA Data |
| NorthWest |
| Oregon |
| Washington |
| Extreme Weather |
| Past Was Warmer |
| NASA: 30's Hotter |
| PastBeliefs |
| HistoryOFAlarmism |
| Central England |
| Temperature History |
| MultiProxy |
| treemometers |
| Northwest Passage |
| Acidification-Ball |
| Acidification-Fulks |
| Acidification-Idso |
| Selected Emails |
| CRU Emails - html formatted |
| CRU Emails Simple Format |
| CRU Emails UnFormatted |
| DCPS paper |
| CRU_Files_Notice |
| False Deadlines |
| Hockey Stick Links |