Home Climate Facts Climate Briefs Alarmist Rebuttals Failed Predictions Historic News Clipings News Reports Russian Money How They Lie to YOU Its OK to Lie! CO2 Facts Warm Periods Lack Of Data Electricity Cost Climate Is Normal Heat/Cold Deaths Wild Fires Green New Deal No Rapid Waring Sun - Real Cause of Climate Alarmist errors C13/C12 Isotope Ratio oregon_climate_plan Tipping Points Climate Predictions IPCC Says Our Best Data 22 Inconvenient Truths Medieval Warm Period Extinctions Propaganda Fossil Fuel subsidies Who's Lying? What is Real Science Peer Review Adjustment Example proxies Climate Papers Debunking Claims NASA Debunk Antarctic Loss Renewables Corals Trillion Dollar Industry Big Money Scaring green money Paid by fossil fuel Warming Stopped Media Lies People are Dying History (politics) Extreme Weather? Its Warming,But Acidification IPCC_Flawed IPCC Prediction Fail IPCC_Disproved IPCC_PeerReview IPCC Scientists IPCC&CLouds WWF Infiltrated the IPCC Harming People misconduct Data Adjustments Major Data Tampering Cooling since 1945? Drought, hurricanes etc. Arctic History Selected Emails Selected Quotes Fraud Of Century? 97 percent of scientists 97% is meaningless 25% of AMS / 50% JonesInterview An OK Prediction Data Sources Record Temperature Energy Facts GridStorage CostlyEnergy Michael Mann Mann's Book Wegman on Mann paper styn_vs_mann Peer Review Error Statistical Errors The Sun Solar OceanHeat Ocean Heat Polar Bears OK AlGore's Errors Ask Questions Climate Models Record Highs Local Food Threats Why I'm a Skeptic GreenhouseMoon Alternative Energy 1350+ realist papers Conflict of Interest? Muzzeled Scientists How To Argue Common Ground Hurricane No Proof NW Snow Pack James Hansen Consensus The Hockey Stick 650 Dissenters Easy Solution DataQuality Heat Island Is Science Settled? Ocean Level Sea Level sea_&_islands Glaciers Ice Sheets Greenland Gore's Mentor OGWC Articles Summary FinancialPapers OtherMotivations PeakOil Ozone Hole Fracking Acid Rain No Limits Videos Printables Links EcoTretas Selected Emails Briffa et al (1998) data


Debunking the Climate Scam

Billions of Dollars -  Fudged Data  -  Corrupt Scientists

Greedy Green Corporations - Trillion Dollar Prize

No Warming For Two decades - Illiterate Media

Bought and Paid For Organizations


5000 Years Of Climate Change From Greenland Ice Cores

pp441685df.png

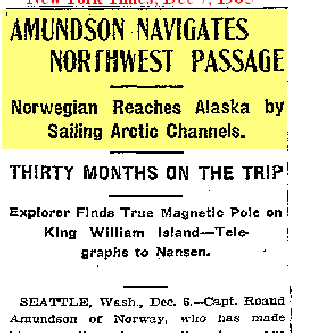
New York Times Dec 7, 1905


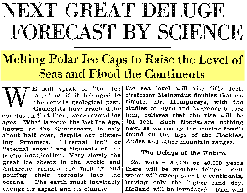
New York Times May 15, 1932
pp0ccbd173.png

What Is Good Quality Proof?

Here is the Minimum Standard of Proof Required Before Taking Climate Action


Absent proof that man is the cause of warming, no cessation of man's activities will change the weather and will have no effect on cuddly polar bears, glaciers, ice caps or ocean levels.

What about The Sun?
It has been known for over 200 years that there is a relationship between the price of wheat and sunspots. William Herschel reported that finding to the Royal Society in 1801.  (Herschel, W., 1801, Philosophical Transactions, 91, 265.)
The Sun is a much better short term fit to climate than CO2.
It has recently been shown that there is a good correlation between solar cycle length and climate, as this chart shows.

Notice the dip in both solar and temperature from about 1940-1965. There is no such dip in graphs of  CO2.

Graph  adapted by Dr. Tim Patterson.from: Friis-Christensen, E., and K. Lassen, Science, 254, 698-700, 1991
The Sun is a much better long term fit to climate than CO2
Here is a long term chart of solar cycle length and temperature as implied by an isotope of Oxygen. Historic CO2 levels do not show any of these ups and downs. Again the sun is a better fit than CO2.

Graph from:  Long-term Variations in Solar Activity and their Apparent Effect on the Earth's Climate  K.Lassen, Danish Meteorological Institute, Solar-Terrestrial Physics Division, Lyngbyvej,100, DK-2100 Copenhagen (2), Denmark.
http://www.tmgnow.com/repository/solar/lassen1.html

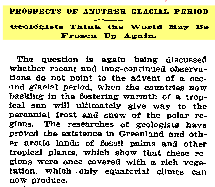
First, A Brief History of Climate Change

New York Times Feb 24, 1895
pp9a38c577.png

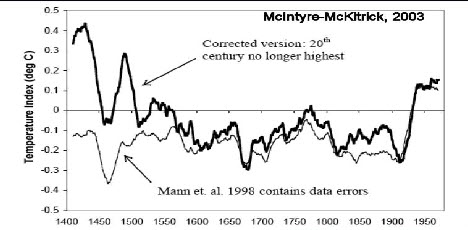
Things Look Different When You See the Whole History
pp52dd7838.jpg ppdbafc0f4.png ppb8029bb6.png

600 year history -- Today is actually cooler than medieval times

Source: Energy & Environment · Vol. 14, No. 6, 2003, pg 77
ppd420c0d2.jpg

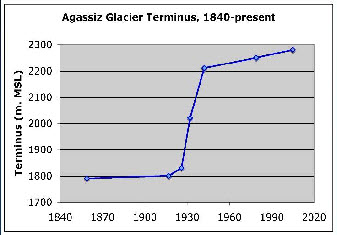
The majority of the glacier melting

occurred during the 1930s
pp0921873d.jpg

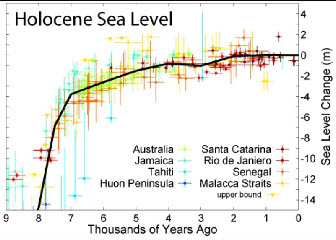
Sea Levels have been rising for thousands of years. Lately the rise has slowed down.

Slower Rise
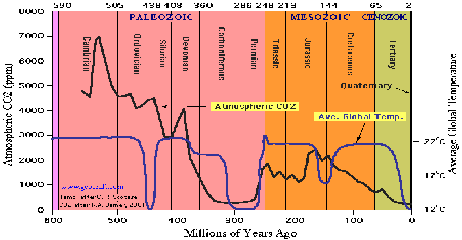
pp2c178d2f.png ppd31a81b8.png ppf65a94b8.png pp31b68a7f.gif

Late Carboniferous to Early Permian time (315 mya -- 270 mya) is the only time period in the last 600 million years when both  atmospheric CO2 and temperatures were as low as they are today (Quaternary Period ).


Temperature after C.R. Scotese http://www.scotese.com/climate.htm

CO2 after R.A. Berner, 2001 (GEOCARB III)


Today is unusually COOL with unusually low CO2

http://www.icecap.us/

http://surfacestations.org/

http://www.co2science.org/

http://www.junkscience.com/

http://www.climateaudit.org/

www.FriendsOfScience.org

http://scienceandpublicpolicy.org/

http://www.climate-skeptic.com/

http://www.worldclimatereport.com/

Additional Information

PDF of this Page

Friis-Christensen, E., and K. Lassen, Length of the solar cycle: An indicator of solar activity closely associated with climate, Science, 254, 698-700, 1991).


Proc. R. Soc. A  doi:10.1098/rspa.2006.1773


Henrik Svensmark, Cosmoclimatology: a new theory emerges - A&G • February 2007 • Vol. 48


NAS report: www.nap.edu/catalog/11676.html


Wegman factsheet: http://republicans.energycommerce.house.gov/108/home/07142006_Wegman_fact_sheet.pdf

Wegman Report:  http://www.uoguelph.ca/~rmckitri/research/WegmanReport.pdf

References

A note:

Coal is carbon taken out of the atmosphere by plants that ended up buried. Two conclusions come from this:

1. The earlier atmosphere had much more CO2 than now (and the earth did not turn into a burnt cinder.)

2. Returning that carbon to the atmosphere will, at most, merely return to the conditions of an earlier atmosphere. At the least, it will do nothing because of the earth’s natural negative feedback mechanisms.
pp6bbfc7e5.png

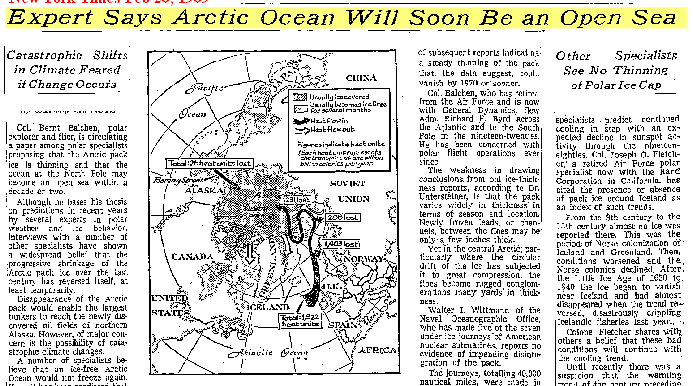
New York Times Feb 20, 1969


pp1941cbb5.png

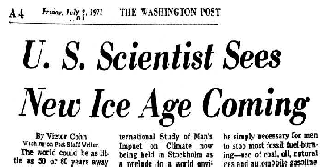
Washington Post July 9, 1971


ppf29f52e5.png

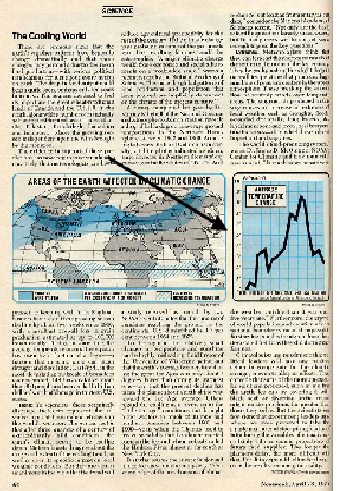
Newsweek, April 28, 1975 - The Cooling World

Notice the Dramatic

Graph of COOLING

Just like You See

For WARMING Today.
ppa9b5aa93.png

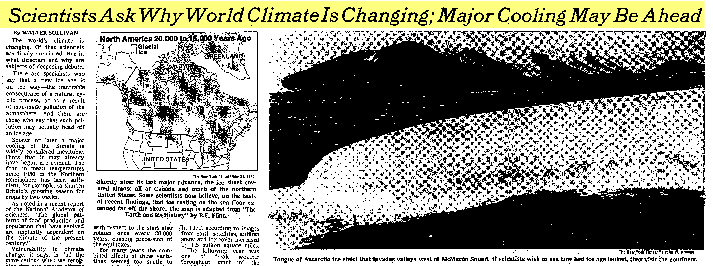
New York Times May 21, 1975


Some Climate Facts
FACT: FIRST the temperature goes up, THEN CO2 goes up.
At least three careful ice core studies have shown that CO2 starts to rise about 800 years (600-1000 years) after Antarctic temperature during glacial terminations. These terminations are pronounced warming periods that mark the ends of the ice ages that happen every 100,000 years or so.
... All that the lag shows is that CO2 did not cause the first 800 years of warming, out of the 5000 year trend. The other 4200 years of warming could in fact have been caused by CO2, as far as we can tell from this ice core data.    (From: realclimate.org/index.php?p=13) (Notice “could in fact have been”? That means that they don’t really know.)
The Famous Temperature Chart that Al Gore used is simply wrong.
Here is what Dr. Wegman, past president of the statistics division of the National Academy of Sciences says about the temperature chart the AL Gore uses. (MBH98 and MBH99 are the scientific papers that created Al Gore’s chart; MM03/05a/05b are the scientific papers that pointed out the errors in MBH98 and MBH99):
In general, we found MBH98 and MBH99  to be somewhat obscure and incomplete ... Normally, one would try to select a calibration dataset that is representative of the entire dataset. The 1902-1995 data is not fully appropriate for calibration and leads to a misuse in principal component analysis.  (From: 07142006_Wegman_Report.pdf, page 4  Alternative source)
The criticism in MM03/05a/05b  pointed out a number of flaws such as:
·
You can take red noise and put it into the algorithm used in MBH98 and get the famous hockey stick.
·
You can remove the bristle cone pines from the data set and the hockey stick disappears.
·
If you use the correct data centering methodology, the hockey stick disappears.
The whole field of climate prediction is fatally flawed because
most of the field uses the same data and methods - they are not independent.
Wegman: page 4:  Our findings from this analysis suggest that authors in the area of paleoclimate studies are closely connected and thus “independent studies” may not be as independent as they might appear on the surface.   (From: 07142006_Wegman_Report.pdf, page 4  Alternative source)
FACT: Water vapor is the major greenhouse gas, NOT CO2.
. . . the maximum supportable number for the importance of water vapour alone is about 60-70% and for water plus clouds 80-90% of the present day greenhouse effect. (Of course, using the same approach,  the maximum supportable number for CO2 is 20-30%, (From: realclimate.org/index.php?p=142)  (This web site run warming advocate)

A complete list of things caused by global warming


Acne, agricultural land increase, Afghan poppies destroyed, Africa devastated,  Africa in conflict, African aid threatened, African summer frost, aggressive weeds, air pressure changes,  airport malaria, Agulhas current, Alaska reshaped, moves,  allergy season longer, alligators in the Thames, Alps melting, Amazon a desert, American dream end,  amphibians breeding earlier (or not),  anaphylactic reactions to bee stings,  ancient forests dramatically changed, animals head for the hills, animals shrink, Antarctic grass flourishes, Antarctic ice grows, Antarctic ice shrinks, Antarctic sea life at risk,   anxiety treatment, algal blooms, archaeological sites threatened, Arctic bogs melt, Arctic in bloom, Arctic ice free, Arctic ice melt faster, Arctic lakes disappear, Arctic tundra to burn, Arctic warming (not), Atlantic less salty, Atlantic more salty,   atmospheric circulation modified, attack of the killer jellyfish, avalanches reduced, avalanches increased,  Baghdad snow, Bahrain under water,  bananas grow, barbarisation, beer shortage, beetle infestation, bet for $10,000


Click on the above to see the complete list  (http://www.numberwatch.co.uk/warmlist.htm)

Alarmists like to talk about an ice free Arctic and of ships sailing through the Northwest Passage.

Here is some history:


Amundson Navigated the Northwest Passage in the early 1900s:

http://en.wikipedia.org/wiki/Roald_Amundsen#Northwest_Passage


Royal Navy Navigated the Northwest passage During World War II:

http://www.ucalgary.ca/arcticexpedition/larsenexpeditions


Sailing the Northwest Passage