Debunking the Climate Scam
Billions of Dollars -
Greedy Green Corporations -
No Warming For Two decades -
Bought and Paid For Organizations

5000 Years Of Climate Change From Greenland Ice Cores

The Best Ground Climate Data We Have

This US Government Graph from: http://www.ncdc.noaa.gov/temp-
Data from NOAA's premiere surface reference network. The contiguous U.S. network
of 114 stations was completed in 2008. There are two USCRN stations in Hawaii and
deployment of a network of 29 stations in Alaska continues. The vision of the USCRN
program is to maintain a sustainable high-
Monthly01 Documentation FTP Client Access
The Best Ground Climate Data by regions (unfortunately no graphs are available yet
https://atmos.uw.edu/marka/crn/
Satellite Data Covers the Whole Earth -
University of alabama at Huntsville(UAH) provides one of two independendt analysis of NASA satellite temperature data

Satellite data from: http://www.drroyspencer.com/2015/08/uah-

Satellite graph from: http://nsstc.uah.edu/climate/
Satellite Data Covers the Whole Earth -
Remote Sensing Systems (RSS) provides a second, independent, analysis of the NASA
satellite data 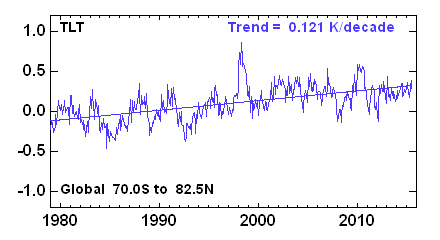
Satellite data from: http://images.remss.com/msu/msu_time_series.html
Radiosonde Data Matches Satellite Data But Goes Back Further
Note the lack of warming since 1958

Estimated lower troposphere global temperature record over the last 50 years
(averaged worldwide radiosonde measurements from weather balloons (Thorne et al. 2005).
Thorne, P.W., D.E. Parker, S.F.B. Tett, P.D. Jones, M. McCarthy, H. Coleman, and P. Brohan (2005).
Revisiting radiosonde upper air temperatures from 1958 to 2002, Journal of Geophysical Research.
110: D18105, doi:10.1029/2004JD005753.
http://onlinelibrary.wiley.com/doi/10.1029/2004JD005753/full
Also see:
http://hadobs.metoffice.com/hadat/hadat2/hadat2_monthly_global_mean.txt
http://hadobs.metoffice.com/hadat/msu_equivalents.html
Another Version of Radiosonde Data

Above is from: https://realclimatescience.com/2016/03/noaa-
Our version: http://hadobs.metoffice.com/hadat/hadat2/hadat2_monthly_global_mean.txt
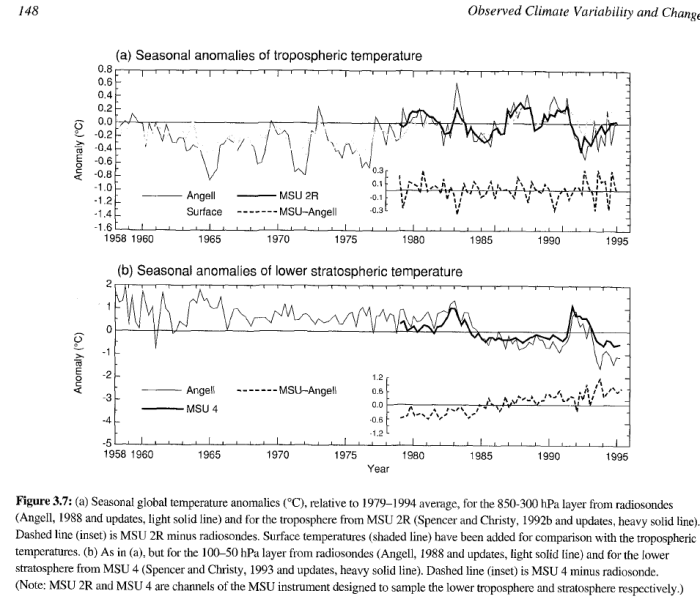
IPCC Version of Radiosonde + Satellite Data
From: Fig 3.7 of https://www.ipcc.ch/ipccreports/sar/wg_I/ipcc_sar_wg_I_full_report.pdf
RURAL DATA avoids Urban Heat Island Effect

Fig. 19 Soon, Willie, Connolly, Ronan, Connolly, Michael, Reevaluating the role of solar variability on Northern Hemisphere temperature trends since the 19th century, Earth Science Reviews (2015), doi: 10.1016/j.earscirev.2015.08.010
Central England Temperature Since 1659 shows little warming
(This is the oldest data we have, but is probably not really the best)
Most rapid warming was in early 1700s (2 degrees in 18 years)
Total rise in 400 years = about 1 degree
Little warming since 1988
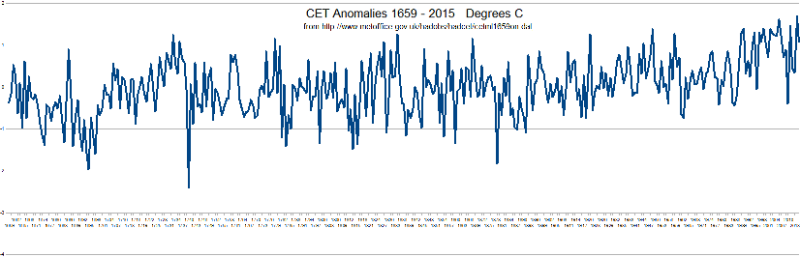
Click graph to enlarge
Data From: http://www.metoffice.gov.uk/hadobs/hadcet/data/download.html
Data file: Monthly_HadCET_mean.txt, 1659 to date (Local-
| Warming Stopped |
| NOAA Data |
| NorthWest |
| Oregon |
| Washington |
| Extreme Weather |
| Past Was Warmer |
| NASA: 30's Hotter |
| HistoryOFAlarmism |
| Central England |
| Temperature History |
| MultiProxy |
| treemometers |
| Northwest Passage |
| Acidification-Ball |
| Acidification-Fulks |
| Acidification-Idso |
| Selected Emails |
| CRU Emails - html formatted |
| CRU Emails Simple Format |
| CRU Emails UnFormatted |
| DCPS paper |
| CRU_Files_Notice |
| False Deadlines |
| Hockey Stick Links |