Home Alarmist errors rebuttal: alarmists’ claims Climate Is Normal IPCC Says Climate Facts Our Best Data Who's Lying? What is Real Science Peer Review proxies Papers Debunking Claims NASA Debunk Antarctic Loss Real Cause of Climate Renewables Corals Trillion Dollar Industry Big Money Scaring green money Russian Money Paid by fossil fuel Warming Stopped Media Lies People are Dying History (politics) Extreme Weather? CO2 didn't warm arctic CO2 & Rate of warming CO2 lags Temperature CO2 Innocent! 1/2 of Warming Wrong Its Warming,But Acidification IPCC_Flawed IPCC Prediction Fail IPCC_Disproved IPCC_PeerReview IPCC Scientists IPCC&CLouds WWF Infiltrated the IPCC Harming People misconduct Data Adjustments Cooling since 1945? Drought, hurricanes etc. Arctic Antarctic Selected Emails Selected Quotes Fraud Of Century? 97 percent of scientists 25% of AMS / 50% JonesInterview An OK Prediction Data Sources False Deadlines Record Temperature Climate Change Truths Its OK to Lie! Energy Facts GridStorage CostlyEnergy Mann's Book Wegman styn_vs_mann Peer Review Error Statistical Errors The Sun Solar OceanHeat Ocean Heat Polar Bears OK AlGore's Errors Ask Questions Climate Models Local Food Threats Why I'm a Skeptic GreenhouseMoon Alternative Energy 1350+ realist papers Conflict of Interest? Muzzeled Scientists How To Argue Common Ground Hurricane No Proof NW Snow Pack James Hansen Consensus The Hockey Stick 650 Dissenters Easy Solution DataQuality Heat Island Is Science Settled? Ocean Level Sea Level sea_&_islands Glaciers Ice Sheets Greenland Gore's Mentor OGWC Articles Summary FinancialPapers OtherMotivations PeakOil Ozone Hole Fracking Acid Rain No Limits Videos Printables Links Briffa et al (1998) data

Debunking the Climate Scam

Billions of Dollars -  Fudged Data  -  Corrupt Scientists

Greedy Green Corporations - Trillion Dollar Prize

No Warming For Two decades - Illiterate Media

Bought and Paid For Organizations


Email WebMaster

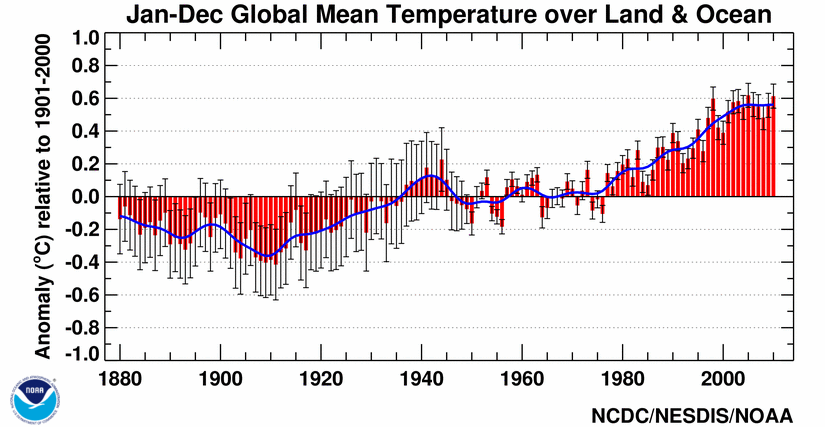
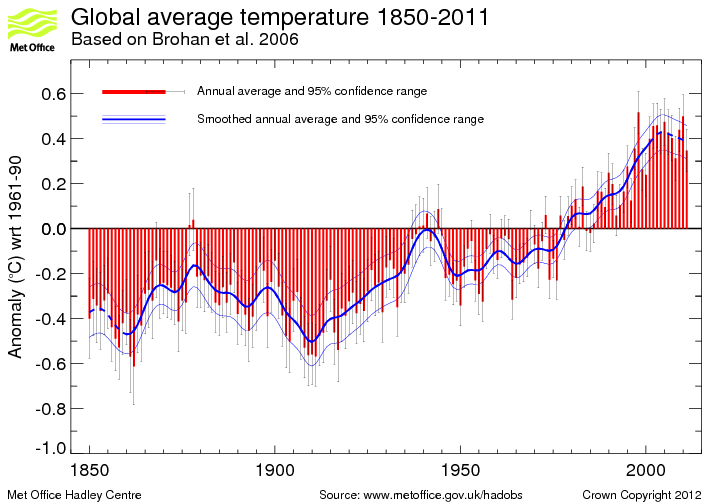
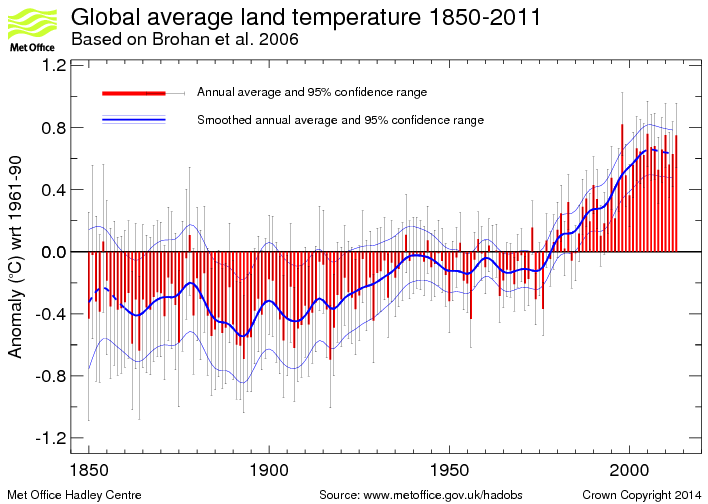
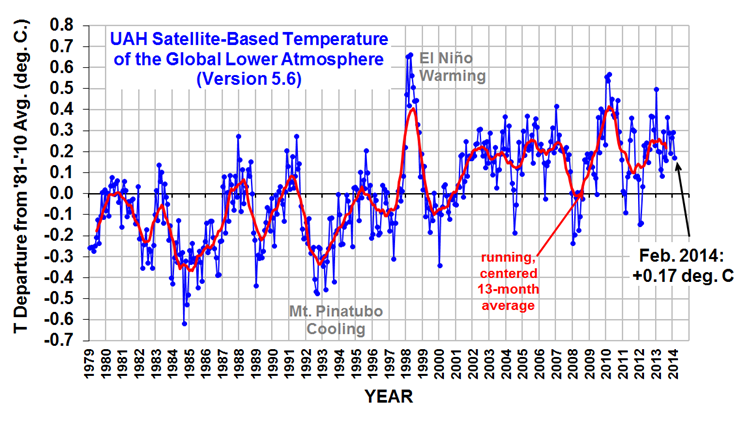
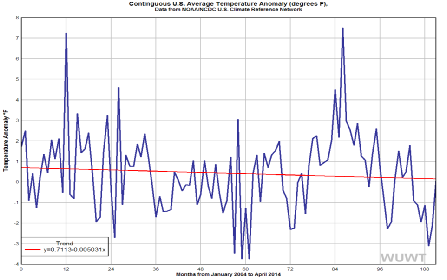
Here are graphs of recent climate directly from the US and British governments and two groups that are the official sources of NASA's satellite climate data. They ALL show no warming for the last decade or more:


From  the US government agency, NOAA:

(http://www.ncdc.noaa.gov/sotc/service/global/global-land-ocean-mntp-anom/201001-201012.gif)


From England’s offician weather service, the Met Office:

(http://www.metoffice.gov.uk/hadobs/hadcrut3/diagnostics/HadCRUT3_bar.png)


US Satellite date from University of Alabama, Huntsville:

http://www.drroyspencer.com/wp-content/uploads/UAH_LT_1979_thru_February_2014_v5.png

Printable PDF of the above charts

US Satellite date from RSS:

(ftp://ftp.ssmi.com/msu/graphics/tlt/plots/rss_ts_channel_tlt_global_land_and_sea_v03_3.png)

U.S. Climate Reference Network (this is a top quality network, covering the USA mainland, established just a few years ago, so it only goes back 10 years)

From Watts Up With That  newer graph  

—––––––––––––––––––––––––––––––––––––––––––––––––––––––––––––––––––-

Here is a summary from Watts Up With That (be sure to see this link for more)


For this analysis, data was retrieved from WoodForTrees.org and the ironically named SkepticalScience.com. This analysis indicates how long there has not been significant warming at the 95% level on various data sets. The first number in each case was sourced from WFT. However the second +/- number was taken from SkepticalScience.com


For RSS the warming is not significant for over 23 years.

For RSS: +0.127 +/-0.136 C/decade at the two sigma level from 1990


For UAH, the warming is not significant for over 19 years.

For UAH: 0.143 +/- 0.173 C/decade at the two sigma level from 1994


For Hacrut3, the warming is not significant for over 19 years.

For Hadcrut3: 0.098 +/- 0.113 C/decade at the two sigma level from 1994


For Hacrut4, the warming is not significant for over 18 years.

For Hadcrut4: 0.095 +/- 0.111 C/decade at the two sigma level from 1995


For GISS, the warming is not significant for over 17 years.

For GISS: 0.116 +/- 0.122 C/decade at the two sigma level from 1996


If you want to know the times to the nearest month that the warming is not significant for each set, they are as follows: RSS since September 1989; UAH since April 1993; Hadcrut3 since September 1993; Hadcrut4 since August 1994; GISS since October 1995 and NOAA since June 1994.


Much more at Watts Up With That


You will find links to these and more at:

http://wattsupwiththat.com/reference-pages/global-weather-climate/global-climate/


also see http://climate4you.com


Nasa chart of 4 major trmperature records - note stasis for last decade or so: http://eoimages.gsfc.nasa.gov/images/imagerecords/80000/80167/adjusted_temperature_anomaly_1880-2012.pdf


BTW, did you know that:

1. Nature emits over 90% of the annual CO2 emission?

2. The ice core data (the ones AL Gore made famous) shows that CO2 follows, NOT leads temperature.

3. Most of the greenhouse effect is caused by water vapor, not CO2


Sources for items 1-3:

1-Add up the carbon sources on this NASA page <http://earthobservatory.nasa.gov/Features/CarbonCycle/page1.php> and you get man's CO2 at about 6% of the total annual emission.


2-http://www.sustainableoregon.com/vostokgraph.html


3-"the maximum supportable number for CO2 is 20-30%" <http://www.realclimate.org/index.php?p=142> Note that realclimate is a web site set up by a liberal PR agency to defend the "hockeystick" shaped temperature curve that AL Gore used in his slideshow.


Government Data: Earth quit Warming a Decade ago!

Slight decline
No temperature increase
 for last 14 years
No temperature increase
 for last 14+ years
No temperature increase
 for last 14+ years
Slight temperature decrease for entire record length (10 years)